The Fish Playbook · Report 01
The NFL Combine's Best 3-Cone Outliers
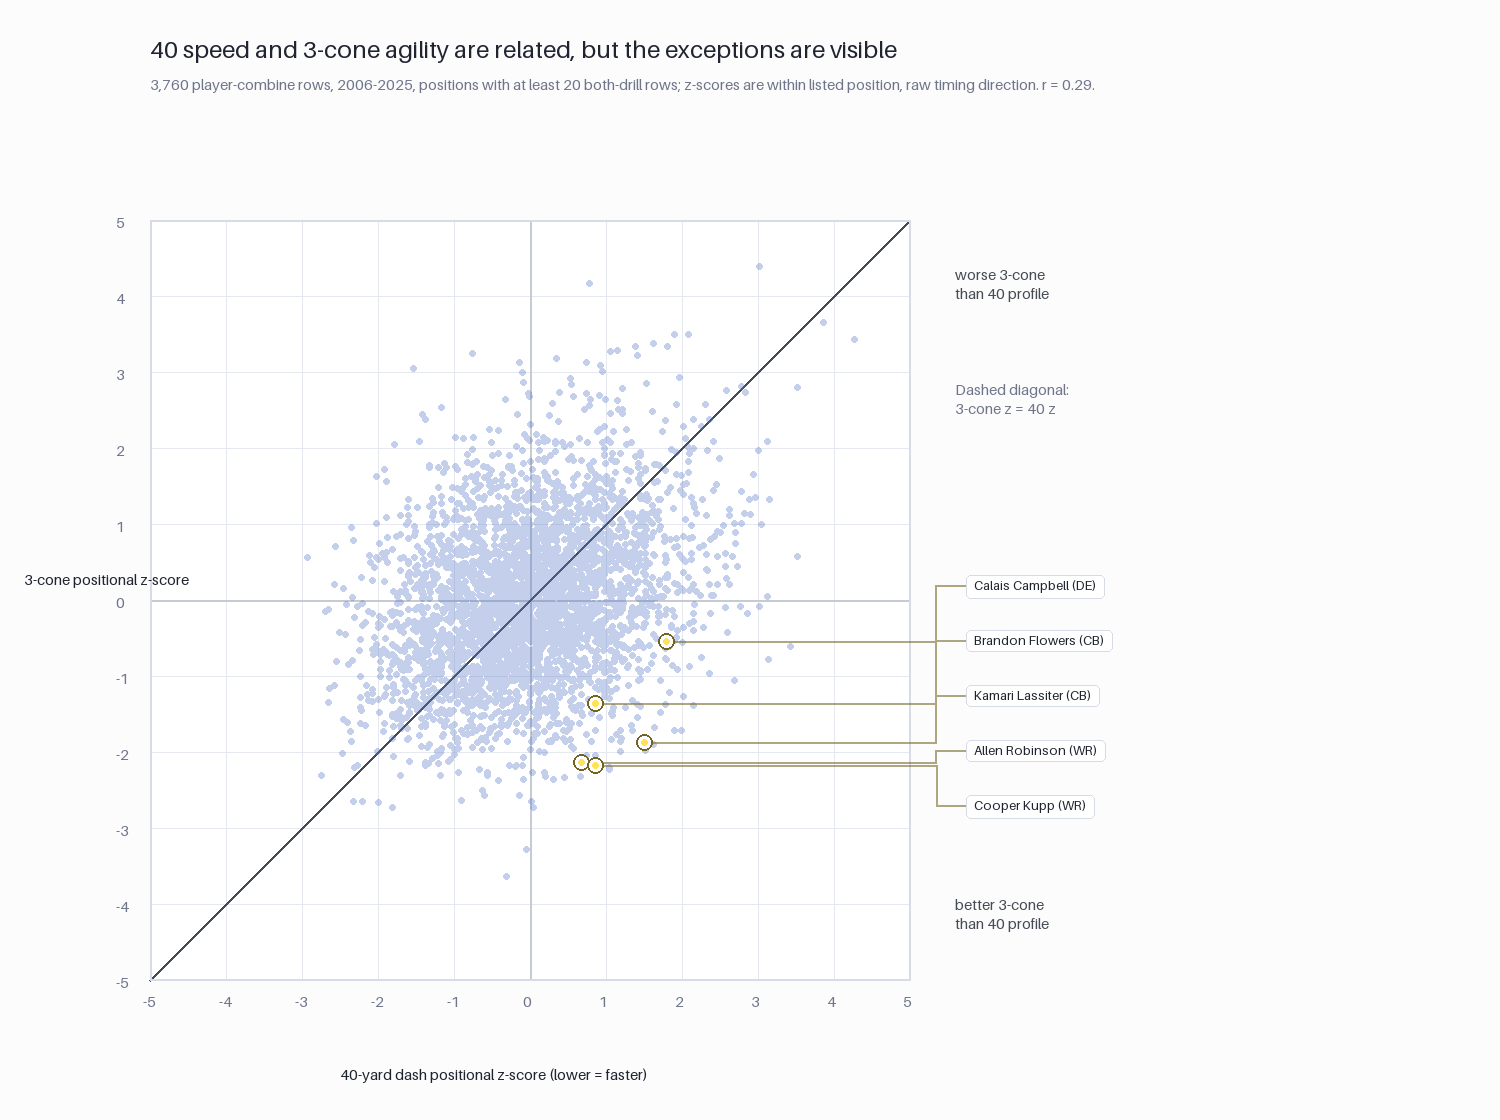
Straight-line speed and short-area agility are related, but only modestly — and the football story lives in the gap between them.
NFL Combine · 2006–2025 · Footballnomics
Executive summary
This report uses a lightweight NFL Combine dataset covering 2006 through 2025. The first pass parsed 8,457 combine rows, including 7,616 with a 40-yard dash time, 3,856 with a 3-cone time, and 3,794 with both drills. Combine records were joined to nflverse draft-pick metadata using a conservative same-year, normalized-name match.
To compare drills fairly, both times are converted to z-scores within listed position. Lower z-scores mean faster than positional average. The final chart uses 3,760 player-combine rows from positions with at least 20 observations in both drills.
The correlation between position-normalized 40-yard dash z-score and position-normalized 3-cone z-score is r = 0.29. Straight-line speed and short-area agility move together, but loosely. The football story lives in the distance from the diagonal.
By the numbers
How to read it
Position first, then distance from the diagonal.
- Both axes are timing z-scores computed within listed position, so a WR is compared to WRs and a DE is compared to DEs.
- Lower is better on both axes. Negative z means faster than the positional average.
- The diagonal marks equal position-relative performance in the two drills.
- Distance from the diagonal is what's interesting. Below the diagonal: better 3-cone than 40 profile. Above the diagonal: worse 3-cone than 40 profile.
Findings
The best 3-cone outliers relative to their 40.
Among players drafted in the first three rounds, a few names jump out: Kamari Lassiter, Cooper Kupp, Allen Robinson, and Calais Campbell all tested meaningfully better in the 3-cone than their 40 profile would suggest. The framing that helps most is not who is fastest? — it is who has the strangest split between long speed and short-area agility?
| # | Player | Year | Pos | Draft | 40 z | 3-cone z | Gap |
|---|---|---|---|---|---|---|---|
| 1 | Kamari Lassiter | 2024 | CB | 2.42, HOU | 1.51 | -1.87 | -3.38 |
| 2 | Paul Dawson | 2015 | ILB | 3.99, CIN | 1.19 | -1.86 | -3.06 |
| 3 | Jairus Byrd | 2009 | CB | 2.42, BUF | 1.83 | -1.21 | -3.04 |
| 4 | Cooper Kupp | 2017 | WR | 3.69, LAR | 0.86 | -2.18 | -3.04 |
| 5 | Allen Robinson | 2014 | WR | 2.61, JAX | 0.67 | -2.14 | -2.81 |
| 6 | Stanley Jean-Baptiste | 2014 | CB | 2.58, NOR | 1.08 | -1.52 | -2.60 |
| 7 | Reggie Smith | 2008 | CB | 3.75, SF | 1.08 | -1.47 | -2.55 |
| 8 | Jamon Brown | 2015 | OT | 3.72, STL | 1.10 | -1.42 | -2.52 |
| 9 | Calais Campbell | 2008 | DE | 2.50, ARI | 1.79 | -0.55 | -2.34 |
| 10 | John Hughes | 2012 | DT | 3.87, CLE | 1.13 | -1.17 | -2.30 |
Gap = 3-cone z − 40 z. More negative means a much better 3-cone than the 40 profile implies.
Body-size context
The data shows the expected body-size relationship. Holding listed position fixed, each additional 10 pounds is associated with about +0.028 s in the 40-yard dash and about +0.034 s in the 3-cone. In plain English: heavier players tend to be slower, even after comparing players within the same listed position.
Methodology
Combine data was pulled from the expanded year tables at NFL Combine Results for every year from 2006 through 2025. Draft metadata came from the nflverse draft_picks.csv release. The combined dataset is saved as nfl_combine_draft_2006_2025.csv and loaded into a local SQLite database for lightweight SQL exploration.
Player names are normalized for joining by lowercasing, removing accents and punctuation, and dropping suffixes such as Jr., Sr., II, III, IV, and V. Draft matching is then performed within the same combine year. The current join is deliberately conservative — exact draft year plus normalized name — which avoids over-matching but leaves some likely true matches for a later fuzzy-review pass.
For the chart, raw drill times are converted to z-scores within listed position and restricted to positions with at least 20 observations in both drills. The final plot uses 3,760 player-combine rows.
Caveats
This is a descriptive combine analysis, not a career-performance model. It should not imply that a better-than-expected 3-cone causes NFL success. It only identifies players whose short-area testing profile diverged from their straight-line testing profile.
The 3-cone is also much less complete than the 40-yard dash in some years. The final plot uses all rows with both drills after requiring sufficient position-level sample size, but year-to-year coverage varies. Source italic flags remain visible in the project and can be used for sensitivity checks.
What's next
The Combine Splits series.
- Add fuzzy draft matching for unmatched drafted players and known name variants.
- Add player outcomes — approximate value, snap counts, second contract, games started.
- Re-run the diagonal-gap analysis by position family, not just listed position.
- Add a sensitivity version that excludes italicized source values where enough data exists.
- Extend the series: 40 vs. shuttle, weight-adjusted speed, and position-specific outlier boards.