The Fish Playbook · Report 02
The John Ross Analysis
Does the NFL Draft overpay for spikiness?
In tech hiring, spikes win. In investing, variance is punished. Wide receivers, John Ross, and 4.22 in the 40 sit right on that seam — and the draft market has already priced the stopwatch in.
By Peter Fishman, with Dan Silberman
WR Combine · 2006–2018 · Footballnomics
In tech, there is a learned taste for spikiness.
The idea is that you do not always want the candidate who is pretty good at everything. You want the person with one extraordinary dimension: the engineer who can see around corners in distributed systems, the designer with taste that changes the whole product, the operator who can turn chaos into process. If you are building a team, a collection of spikes can be more valuable than a collection of smooth B-plus profiles.
That is a strange idea from an investing point of view. If two assets have the same expected return, you usually prefer the safer one. Fix the mean and lower variance is better.
So which world is the NFL draft closer to?
Dan Silberman and I started looking at this through wide receivers, and particularly through John Ross. Dan is a Bengals fan, so the Ross pick is not an abstract case study. Ross ran a 4.22-second 40-yard dash at the 2017 NFL Combine, the fastest official combine 40 at the time, and Cincinnati took him ninth overall. The record stood until Xavier Worthy ran 4.21 in 2024. Ross became the cleanest possible version of the "workout warrior" problem: when one number is that bright, how much does it blind the room?
Our version of the question became:
Holding expected draft value constant, would you rather have the receiver with a balanced workout profile, or the receiver with one spectacular spike?
§ 1
Setting the baseline.
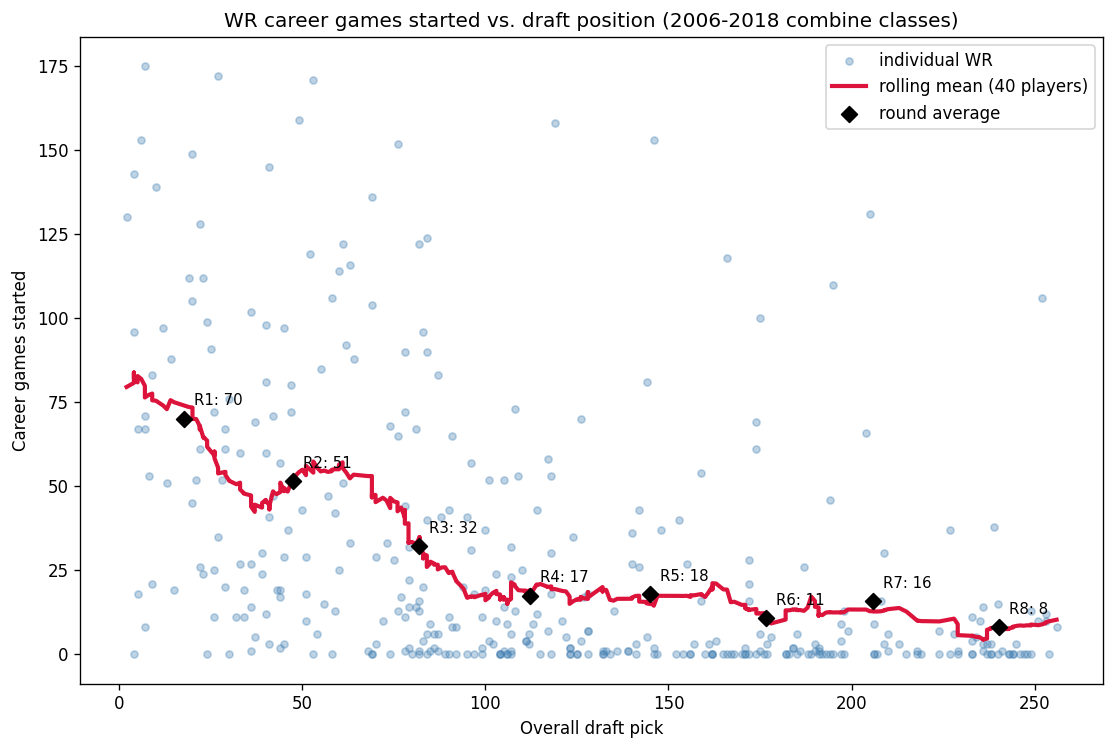
The dataset starts with wide receivers who attended the NFL Combine from 2006 through 2018. We matched combine results to career games started through 2025. Games started is not a perfect measure of receiver quality, but it gives us a rough career-volume outcome that can be compared across draft slots.
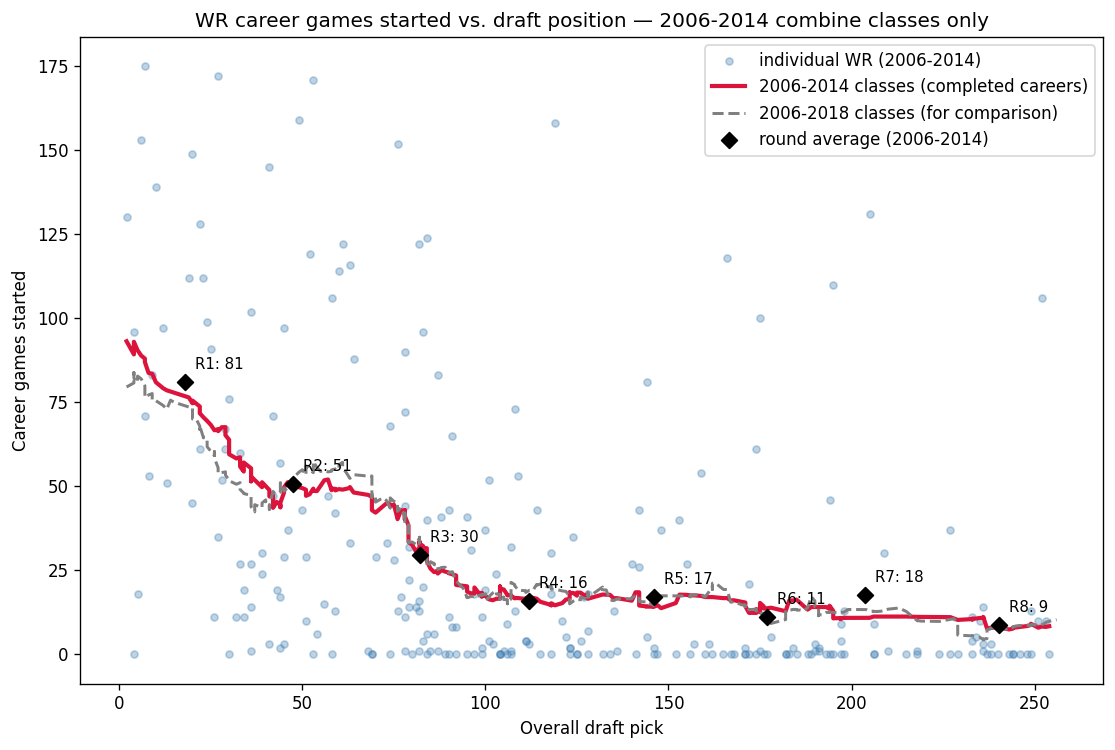
The first thing to handle is expectation. A top-10 pick is supposed to become a starter. A seventh-rounder who starts 20 games beat the market. So raw starts are the wrong target; the target is starts relative to draft position.
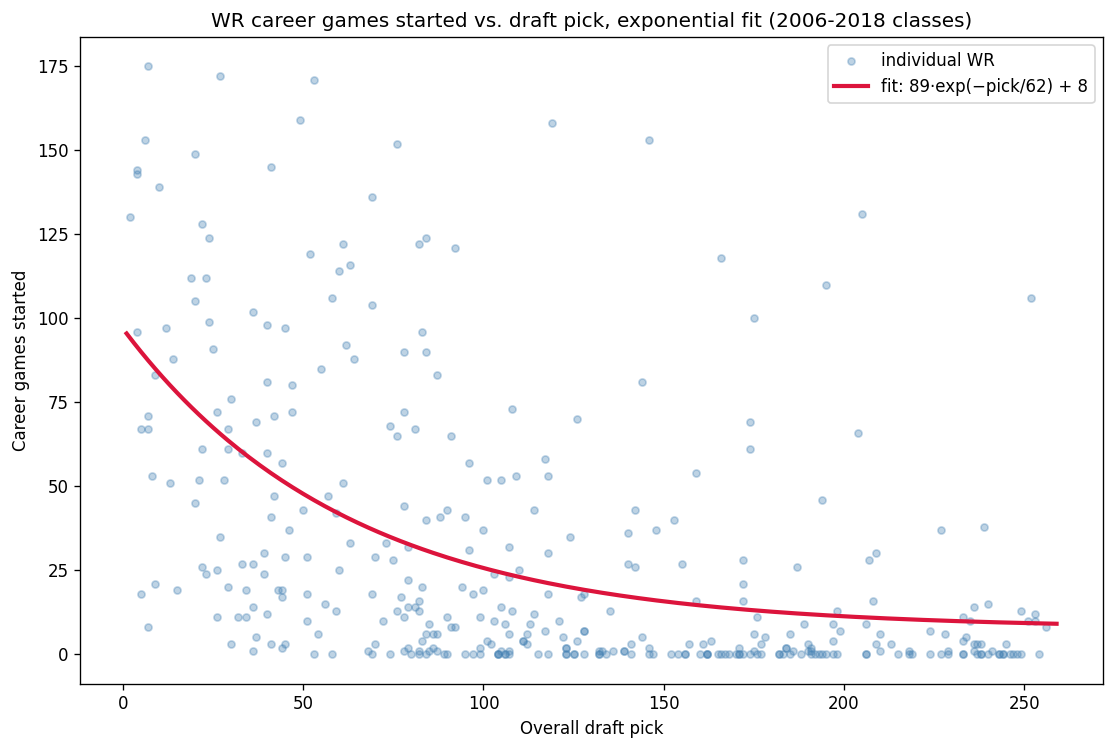
Among drafted receivers, the draft curve is steep early and flat late. In the fitted version, expected career starts are approximately:
89 · exp(−pick / 62) + 8
That means pick 5 carries something like a 90-start expectation, pick 64 is closer to 40, and a late-round pick is down near 10 to 12. From there, every player gets a residual:
actual career starts − expected career starts from draft slot
That residual is the success metric. Mike Evans and Marques Colston are examples of players who smashed expectation. Kevin White, Justin Blackmon, and John Ross sit on the other side.
§ 2
The seductive result.
The most intuitive cut is the one NFL fans already have in their heads: look at the top of the draft and compare the biggest hits to the biggest misses.
Among top-64 wide receivers, the biggest underperformers look more athletic, not less. Their workout profiles are especially strong in the salient drills: the 40 and the broad jump. These are the numbers that make broadcasts, draft shows, and front offices feel like they have seen something undeniable.
The list has the right names for the stereotype: John Ross, Kevin White, Phillip Dorsett, Chad Jackson, Sinorice Moss. Ross is the extreme case, with a 40-yard dash that was three standard deviations better than the wide receiver combine average in this sample.
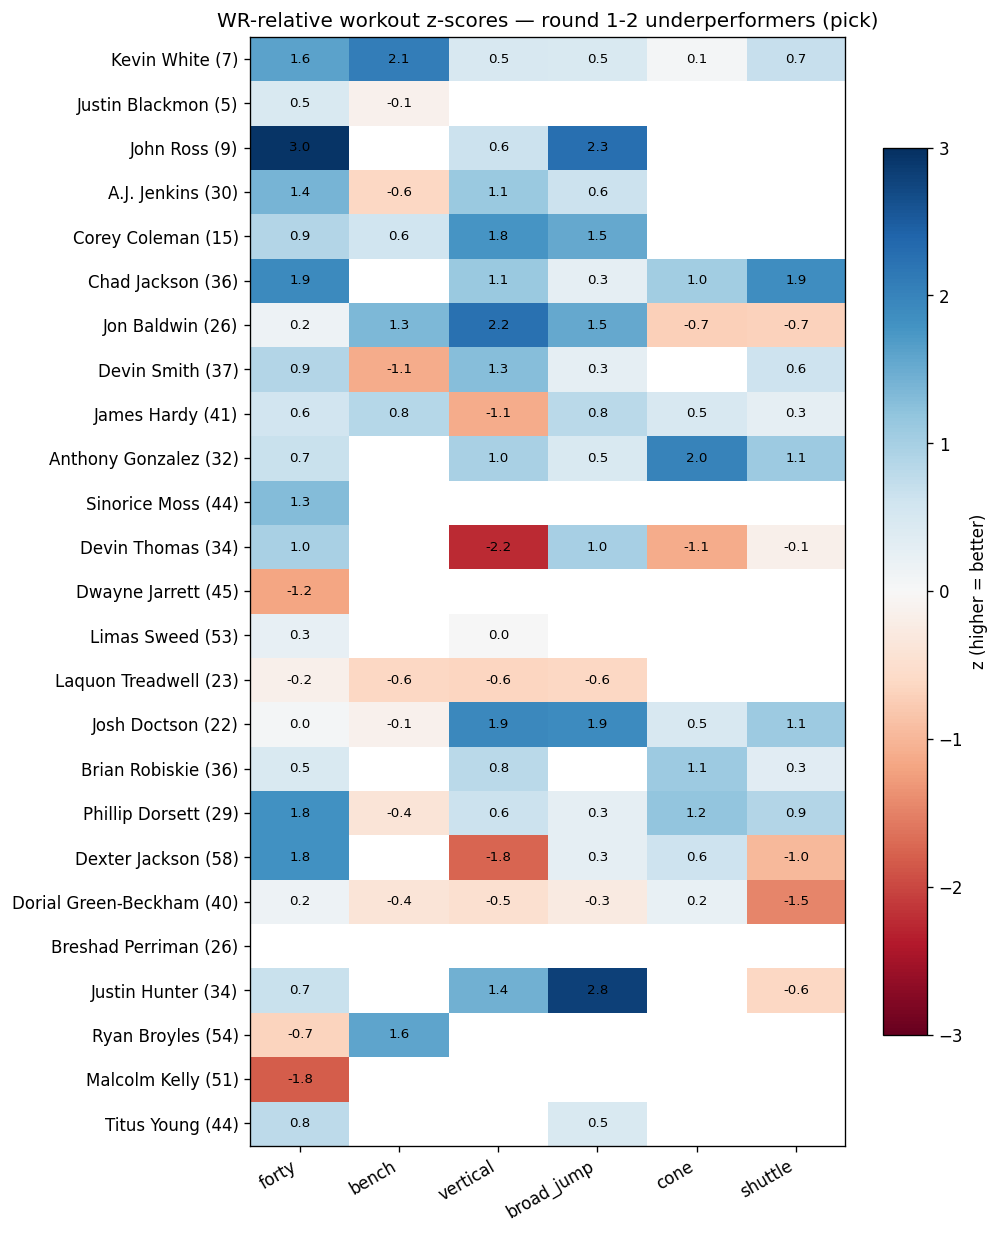
This is the John Ross Analysis in its most emotionally satisfying form: the bust tail is full of visible workout spikes.
The natural explanations are not hard to imagine.
One possibility is noise. A workout is a small sample, and a single timed event can make an athlete look more special than his broader football profile deserves. Another possibility is that wide receiver is a portfolio of skills inside one player. Long speed matters, but so do releases, route tempo, hands, tracking, contact balance, durability, processing, quarterback fit, and scheme. If greatness requires a collection of skills, one huge spike can be less useful than a balanced profile with fewer holes.
§ 3
The twist.
Then we tested spikiness directly.
For each drafted wide receiver with enough workout data, we converted six drills into wide-receiver-relative z-scores: 40, bench, vertical, broad jump, cone, and shuttle. Then we defined "spikiness" as the standard deviation across those workout z-scores.
High standard deviation means an uneven profile: one or two standout numbers, with weaker numbers elsewhere. Low standard deviation means a more balanced athletic profile.
If spiky workout athletes systematically disappoint, spikiness should be negatively related to draft-slot-adjusted success.
The relationship is negative, but barely:
r = −0.03, p = 0.556
Weight, another candidate explanation because many overperforming receivers are physically sturdy, is also basically flat:
r = +0.06, p = 0.338
And a joint model with spikiness, weight, and overall athleticism explains only about 0.6 percent of the variance.
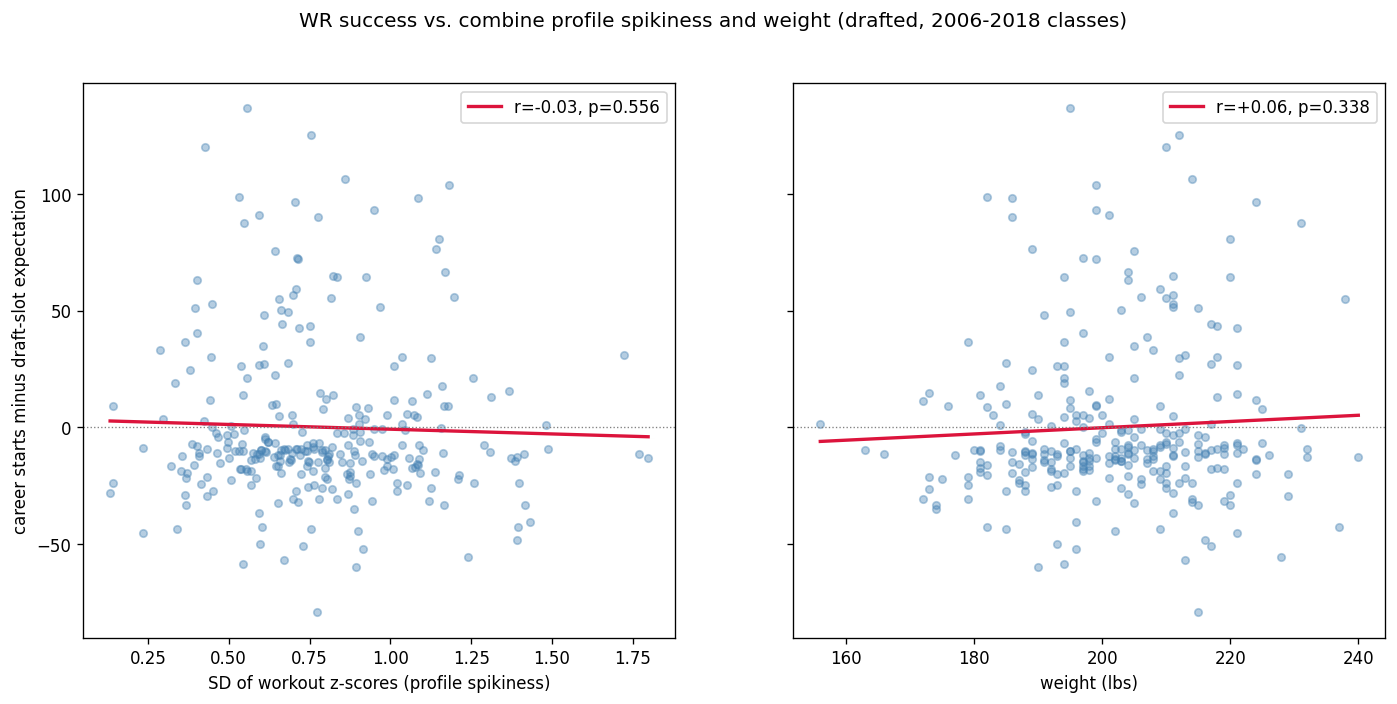
So the careful version is not "spiky receivers always bust." They do not. The full-sample relationship is too weak for that.
The better version is subtler: when a highly drafted receiver's case is built around a vivid workout spike, especially a 40-yard dash, you should worry that the market has already capitalized the sizzle into his draft slot.
The spike does not merely forecast performance. It changes the price.
§ 4
The market prices the stopwatch.
This is the most Footballnomics part of the result.
A great 40 does not sit passively in a prospect's file. It moves mock drafts. It creates a simple story. It gives decision-makers something legible to defend. "He ran 4.22" is easier to say than "his releases against press coverage may not translate."
That means the workout number affects both sides of the ledger:
- It may contain real information about ability.
- It also raises the acquisition cost.
Once we condition on draft slot, the remaining information in the workout profile is thin. The combine has already been priced in. What is left to explain whether a receiver beats his draft slot is mostly the stuff the combine does not measure cleanly.
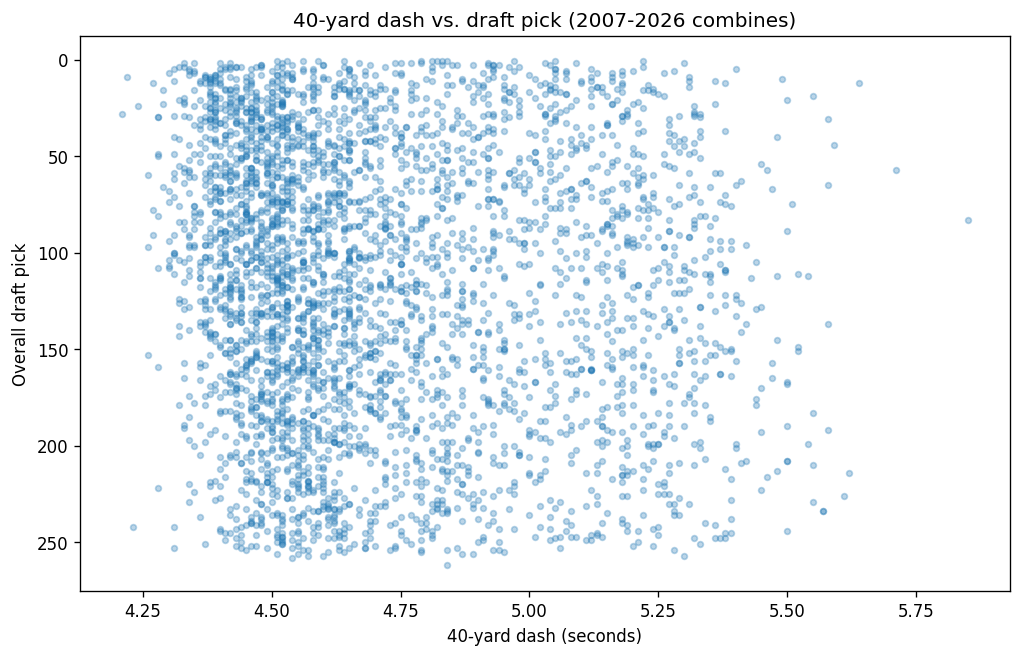
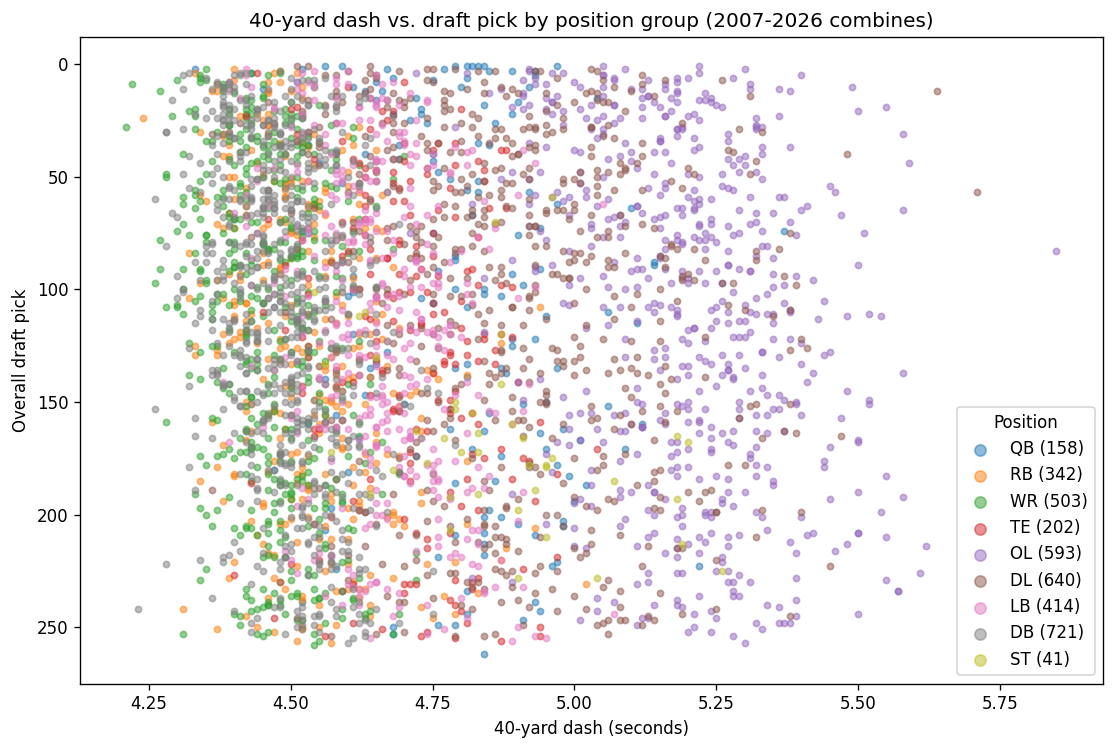
The broader combine picture makes the temptation obvious. Speed is visible, comparable, and easy to rank. It is also position-specific: a 4.45 means something different for a receiver than for a lineman. That is why the analysis uses wide-receiver-relative z-scores rather than raw combine numbers.
§ 5
What the John Ross Analysis says.
The tech hiring analogy is useful, but only up to a point.
On a team, you can assemble complementary spikes. One person's weakness can be covered by someone else's strength. In a receiver prospect, the skills are bundled into one roster spot, one draft pick, one contract, one development path. You cannot pair John Ross's 40 with someone else's route running and call that one wide receiver.
That makes the draft feel less like hiring a spiky team and more like buying an expensive asset whose price already reflects its most visible upside.
Fix the mean — in this case, fix the draft-slot expectation — and the smoother profile starts to look more attractive. Not because balance is magic. Because a single salient spike is easier to overpay for than a broad, boring bundle of competence.
§ 6
Caveats.
- The tail comparison is small. We are looking at groups of about 25 players among top-64 picks, and even the broad-jump gap is suggestive rather than definitive.
- Drill participation is spotty. Some prospects skip agility drills, and missingness may itself carry information.
- Recent classes are truncated. Restricting the draft curve to 2006 through 2014, where careers are more complete, gives a similar shape.
- Games started is blunt. It treats a long, mediocre starting career as a success and misses more granular receiving value.
- Most importantly, this is not an argument that speed is bad. Speed is very good. The warning is about price, salience, and imbalance.
§ 7
The takeaway.
Spikiness is not a clean standalone predictor of wide receiver failure. But the first-round bust tail has a John Ross flavor: spectacular workout numbers, especially in the 40, can make a prospect feel safer than he is.
The practical rule is not "fade fast receivers." It is:
If the easiest argument for a highly drafted receiver is the stopwatch, ask whether the draft slot already charged you for the fantasy.
That is the John Ross Analysis. The market loves a spike. The question is whether the player has enough football underneath it.
Key numbers
Source note
John Ross's 2017 4.22-second combine 40 and ninth-overall selection by Cincinnati are summarized on his Wikipedia page; Xavier Worthy's 4.21 in 2024 later broke the record. The combine and starts analysis comes from the wr_combine_analysis dataset and figures.